


System monitor graph Desklet
Desklet to show graphs for the level of activity in various system variables including: CPU, memory, network and disks. The desklet supports multiple instances with different system variables with the idea of presenting them in a uniform way.
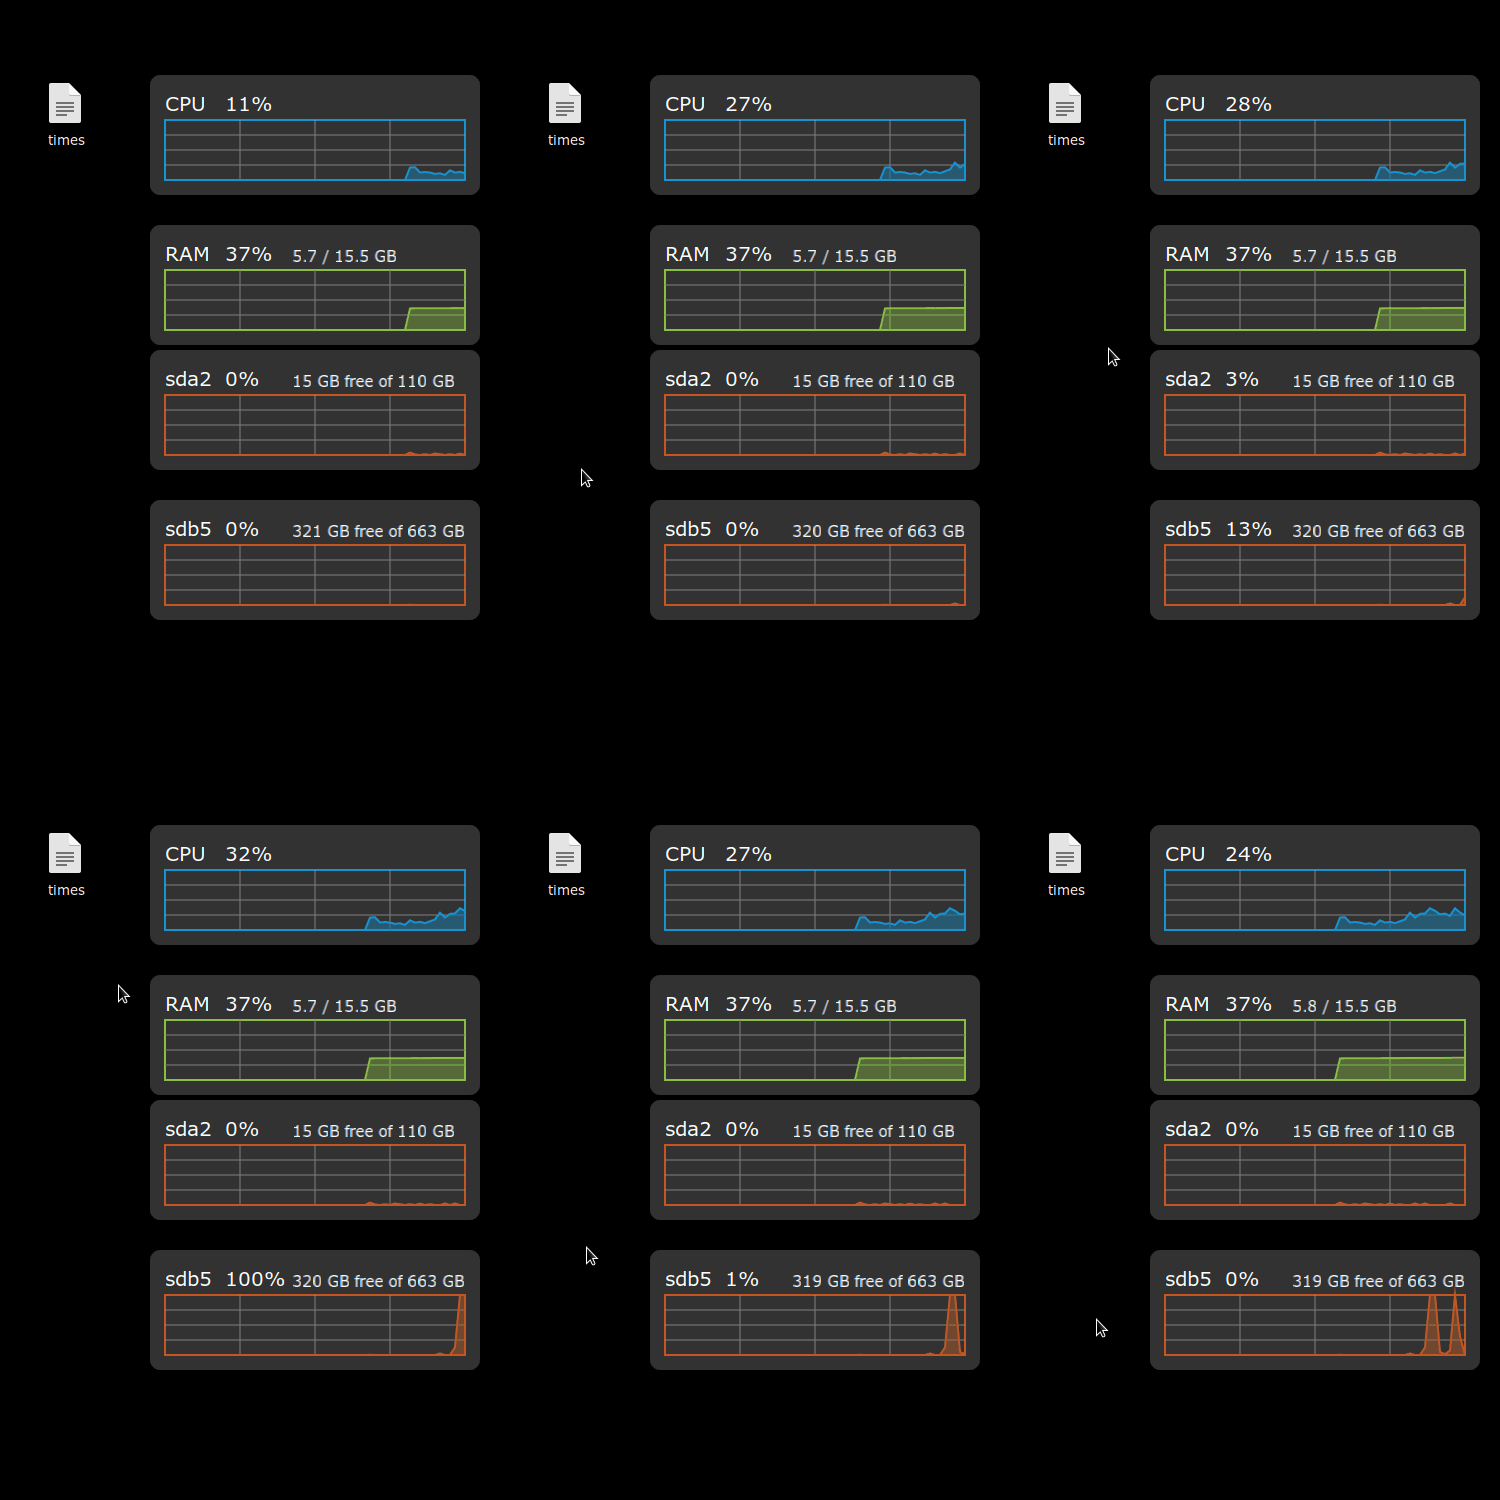
Four instances of the Desklet in action.
This project has been inspired from other Desklets such as Disk Space, CPU Load, Simple system monitor, Network usage monitor, Top, and the Rainmeter Win10 Widgets.
Features
Variables to monitor (v2.0 - July 2025)
| System variable | Description |
|---|---|
| CPU | CPU usage in % |
| RAM | Used RAM as % of total, and in GB |
| Swap | Used Swap space as % of total, and in GB |
| HDD | % of I/O activity, and free and total space in the filesystem (partition) indicated by the user |
| GPU Usage | GPU usage in % |
| GPU Memory | GPU memory usage in % |
| Network | Real-time upload and download speeds with dual-line graph, configurable interface monitoring |
Each variable is calculated every Refresh interval seconds (Min. 1 s, Max. 60 s.), and the graph shows the last Duration of the graph period (Min. 30 s, Max. 60 min).
Customizable visual elements
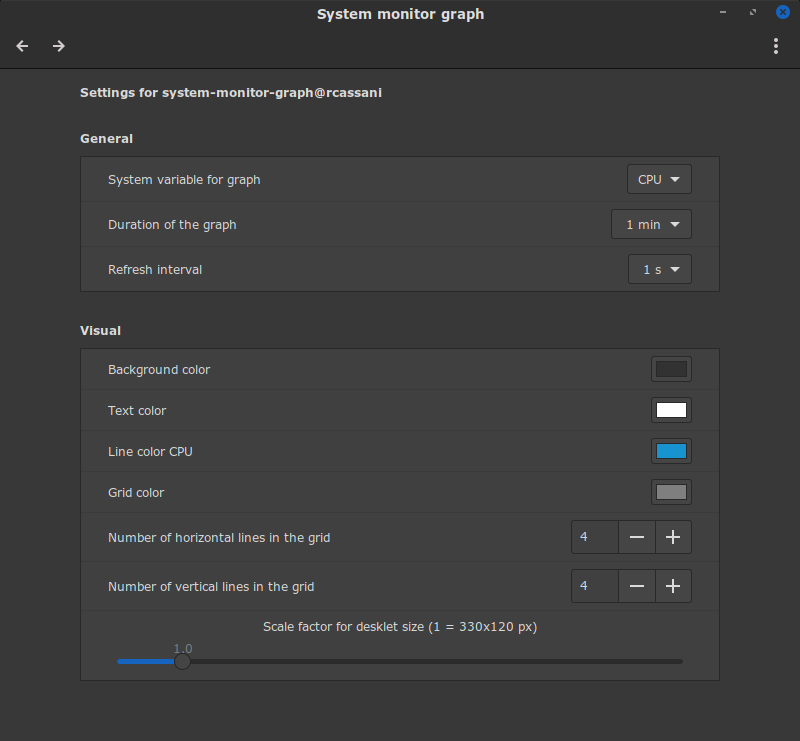
Settings for one instance of the system monitor graph Desklet.
Screenshots
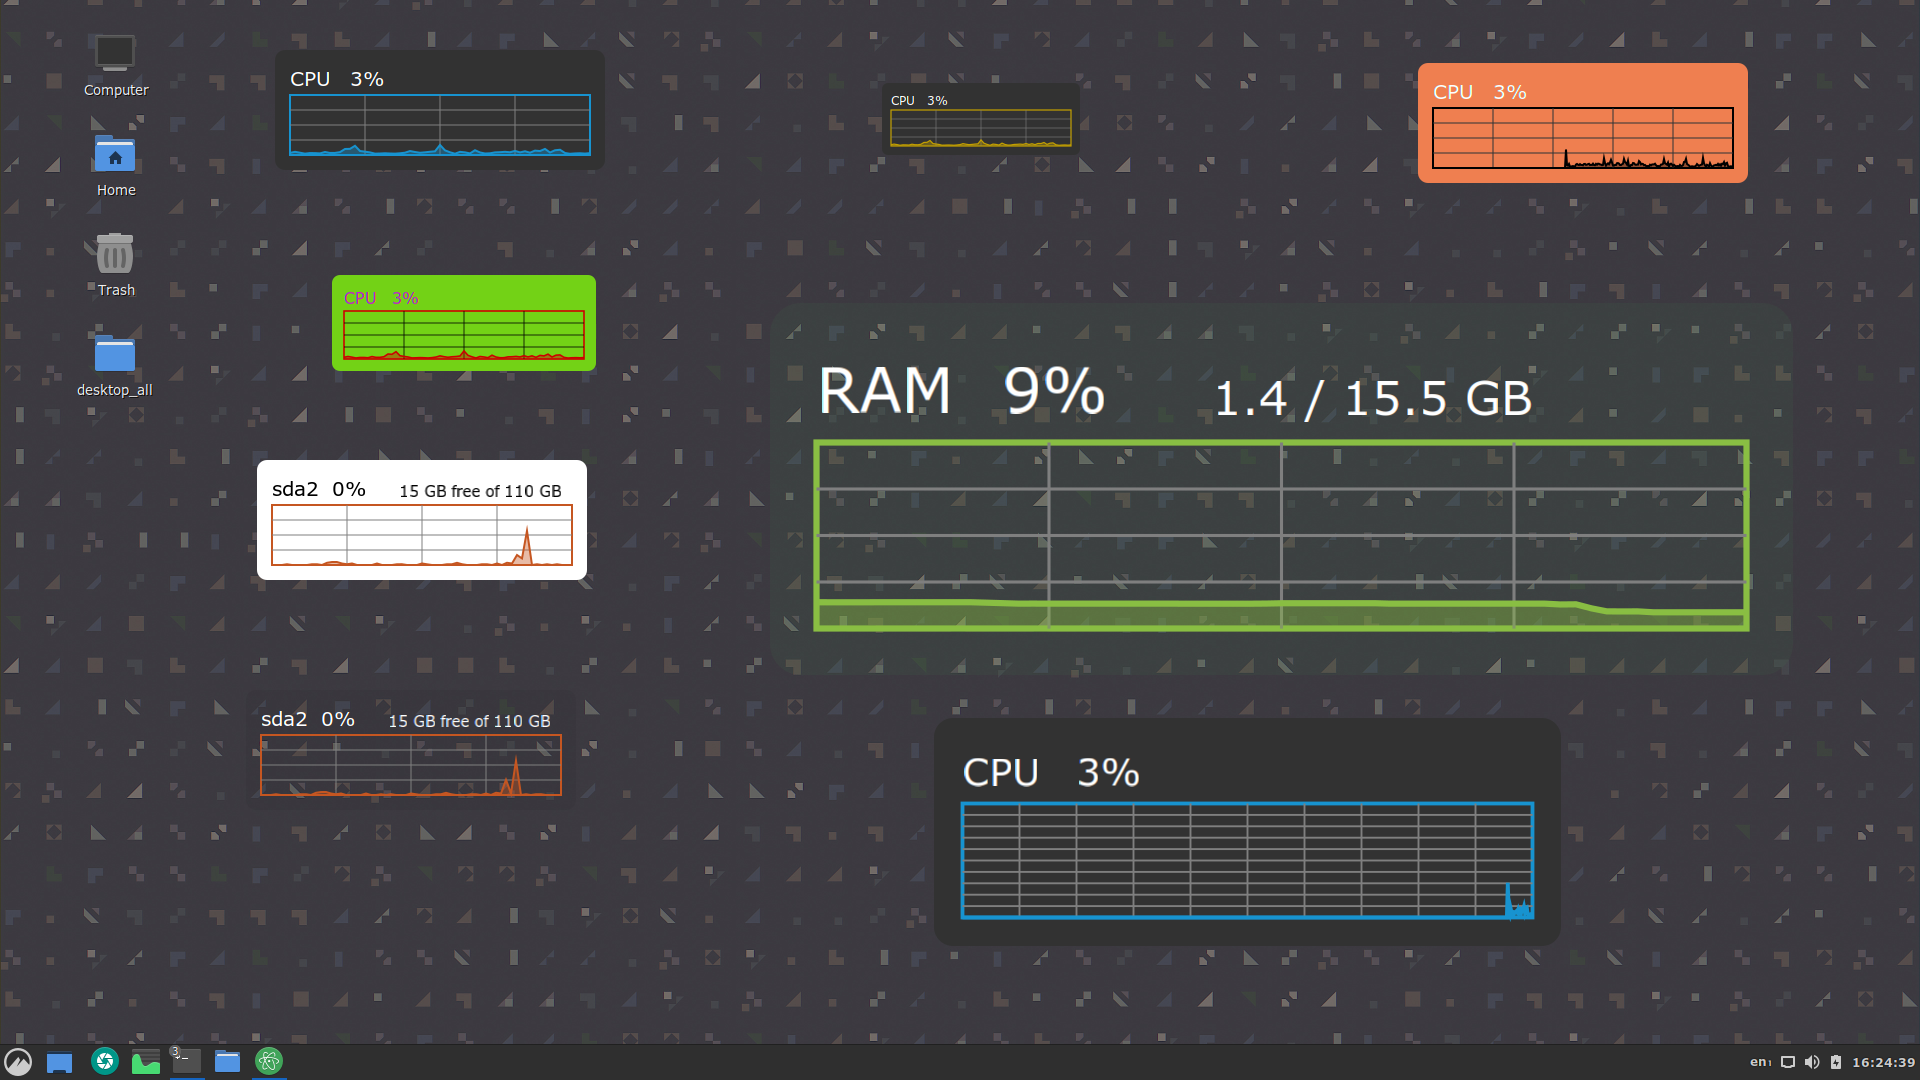
The Desklet is fully customizable.
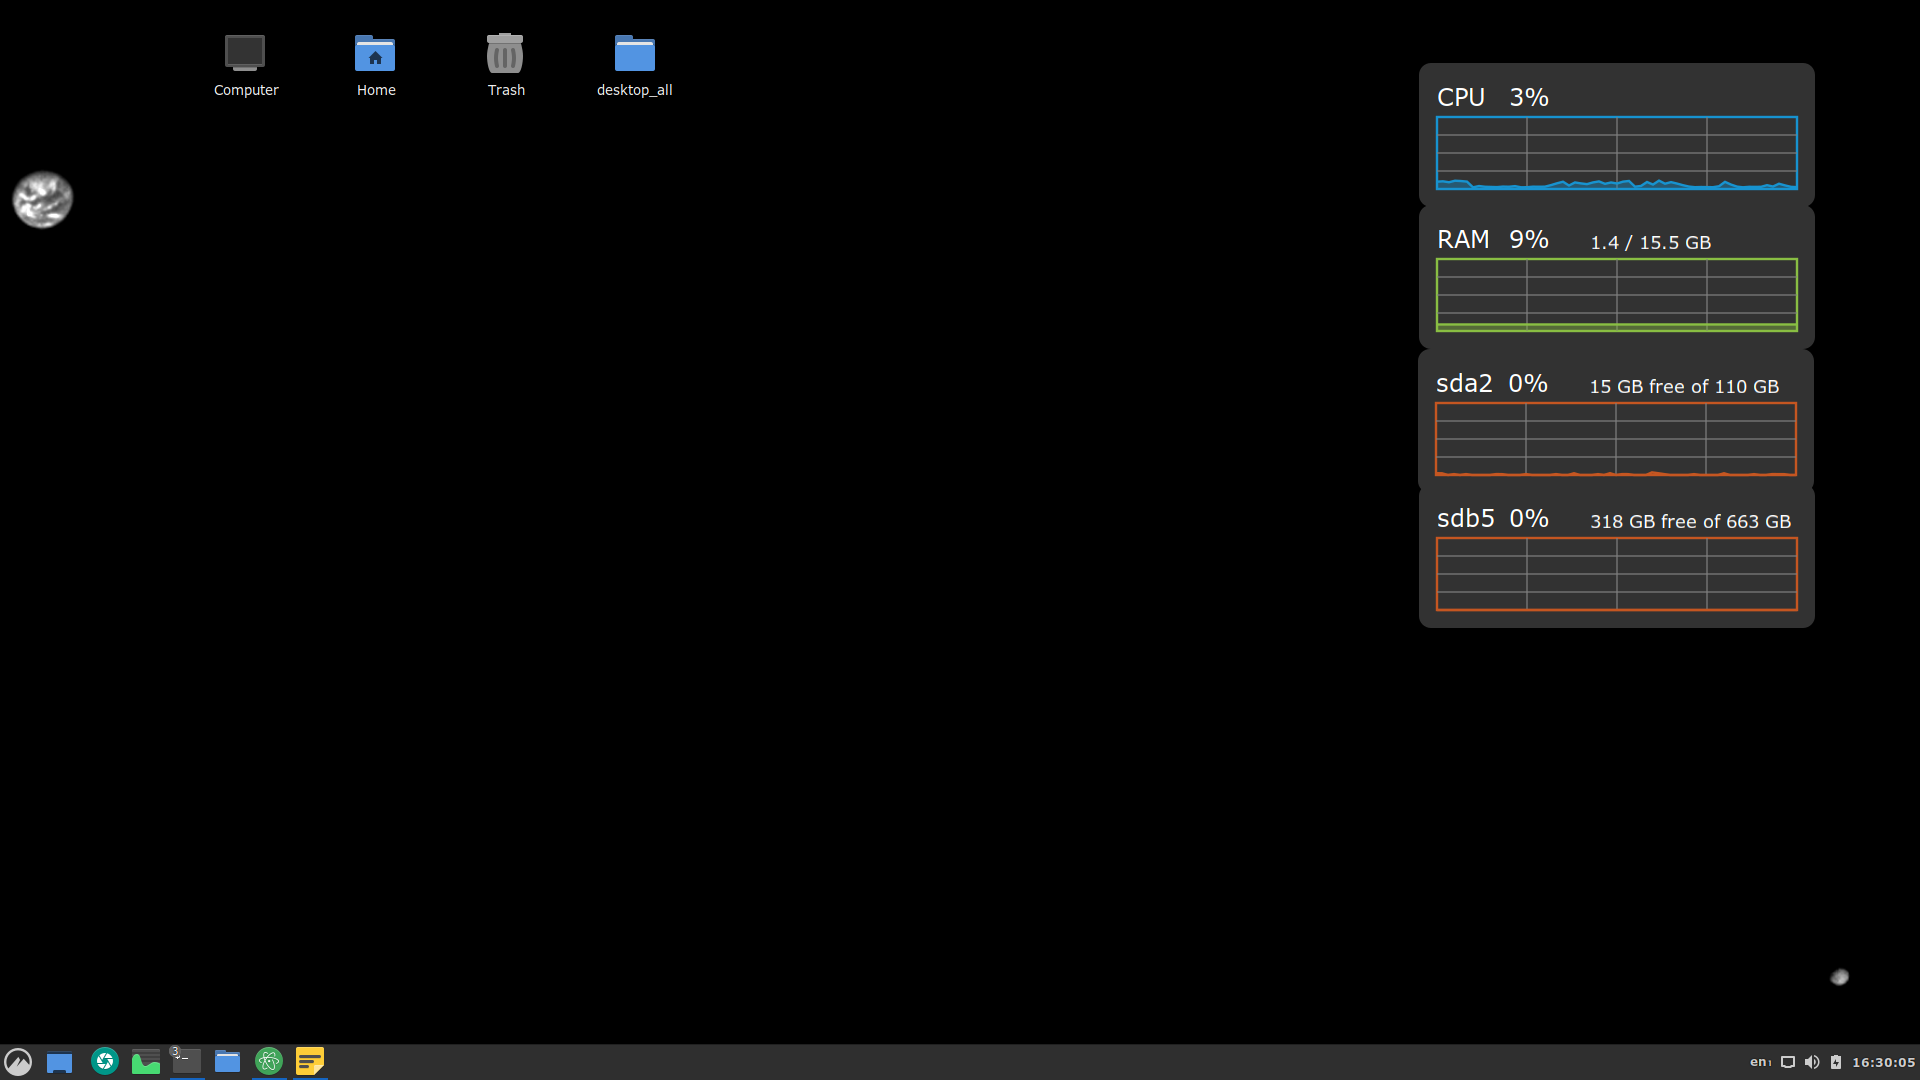
A simple screenshot.
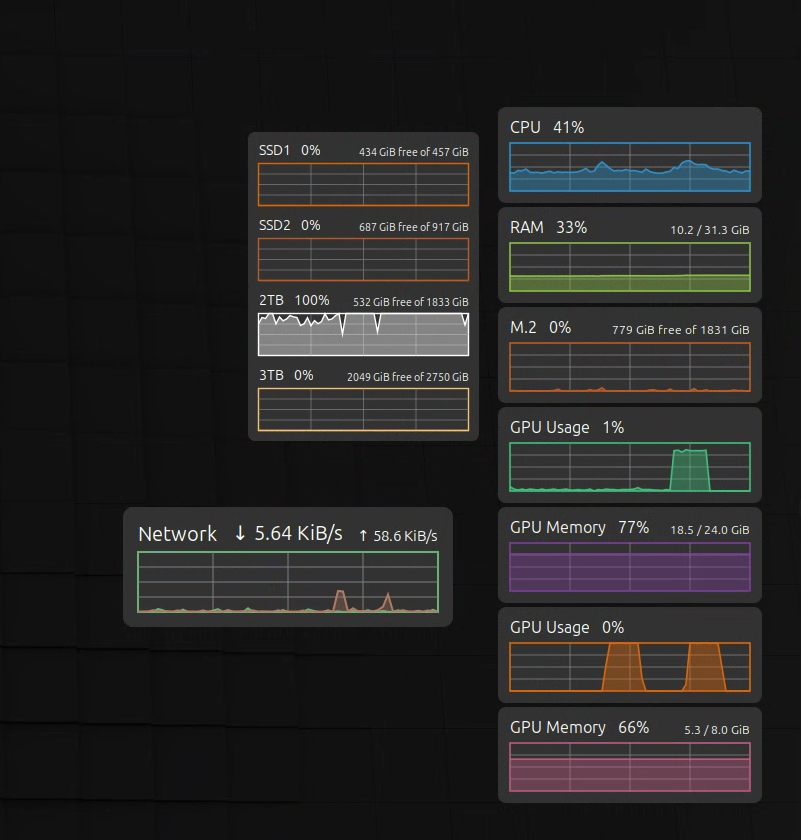
Another screenshot.
TODO
- Add other variables such as
network, CPU and GPU temperatures, battery levels for PC and peripherals.
Resources
This is my first Desklet and the first time using JavaScript. Below, some resources that I used for the development of this Desklet.
- cinnamon-spices-desklets
- JavaScript Tutorial
- CJS: JavaScript bindings for Cinnamon
- CJS the importer
- Applet, desklet and extension settings reference and here
- GJS: JavaScript Bindings for GNOME and here
- GJS examples
- Clutter API
- Computing CPU usage
- Launching sequential processes from desklet
- On Cinnamon.get_file_contents_utf8_sync()
- Default
desklet.jsin Cinnamon - Manual alpha blending
- Cairo documentation